Know your real energy cost. Stress-test your 2027 budget.
One model for your energy cost, hedges and market risk. See what your energy strategy actually costs today, and how it behaves when power, gas and CO2 move.
Your energy budget is a moving target.
Every year, industrial companies build an energy budget around assumptions that change right after it is approved.
Yet the budget often stays a spreadsheet built once in October.Equora keeps the model alive.
Inside the platform
Four views from the model, on fictional mills with synthetic data. We walk you through the full model live in the call.
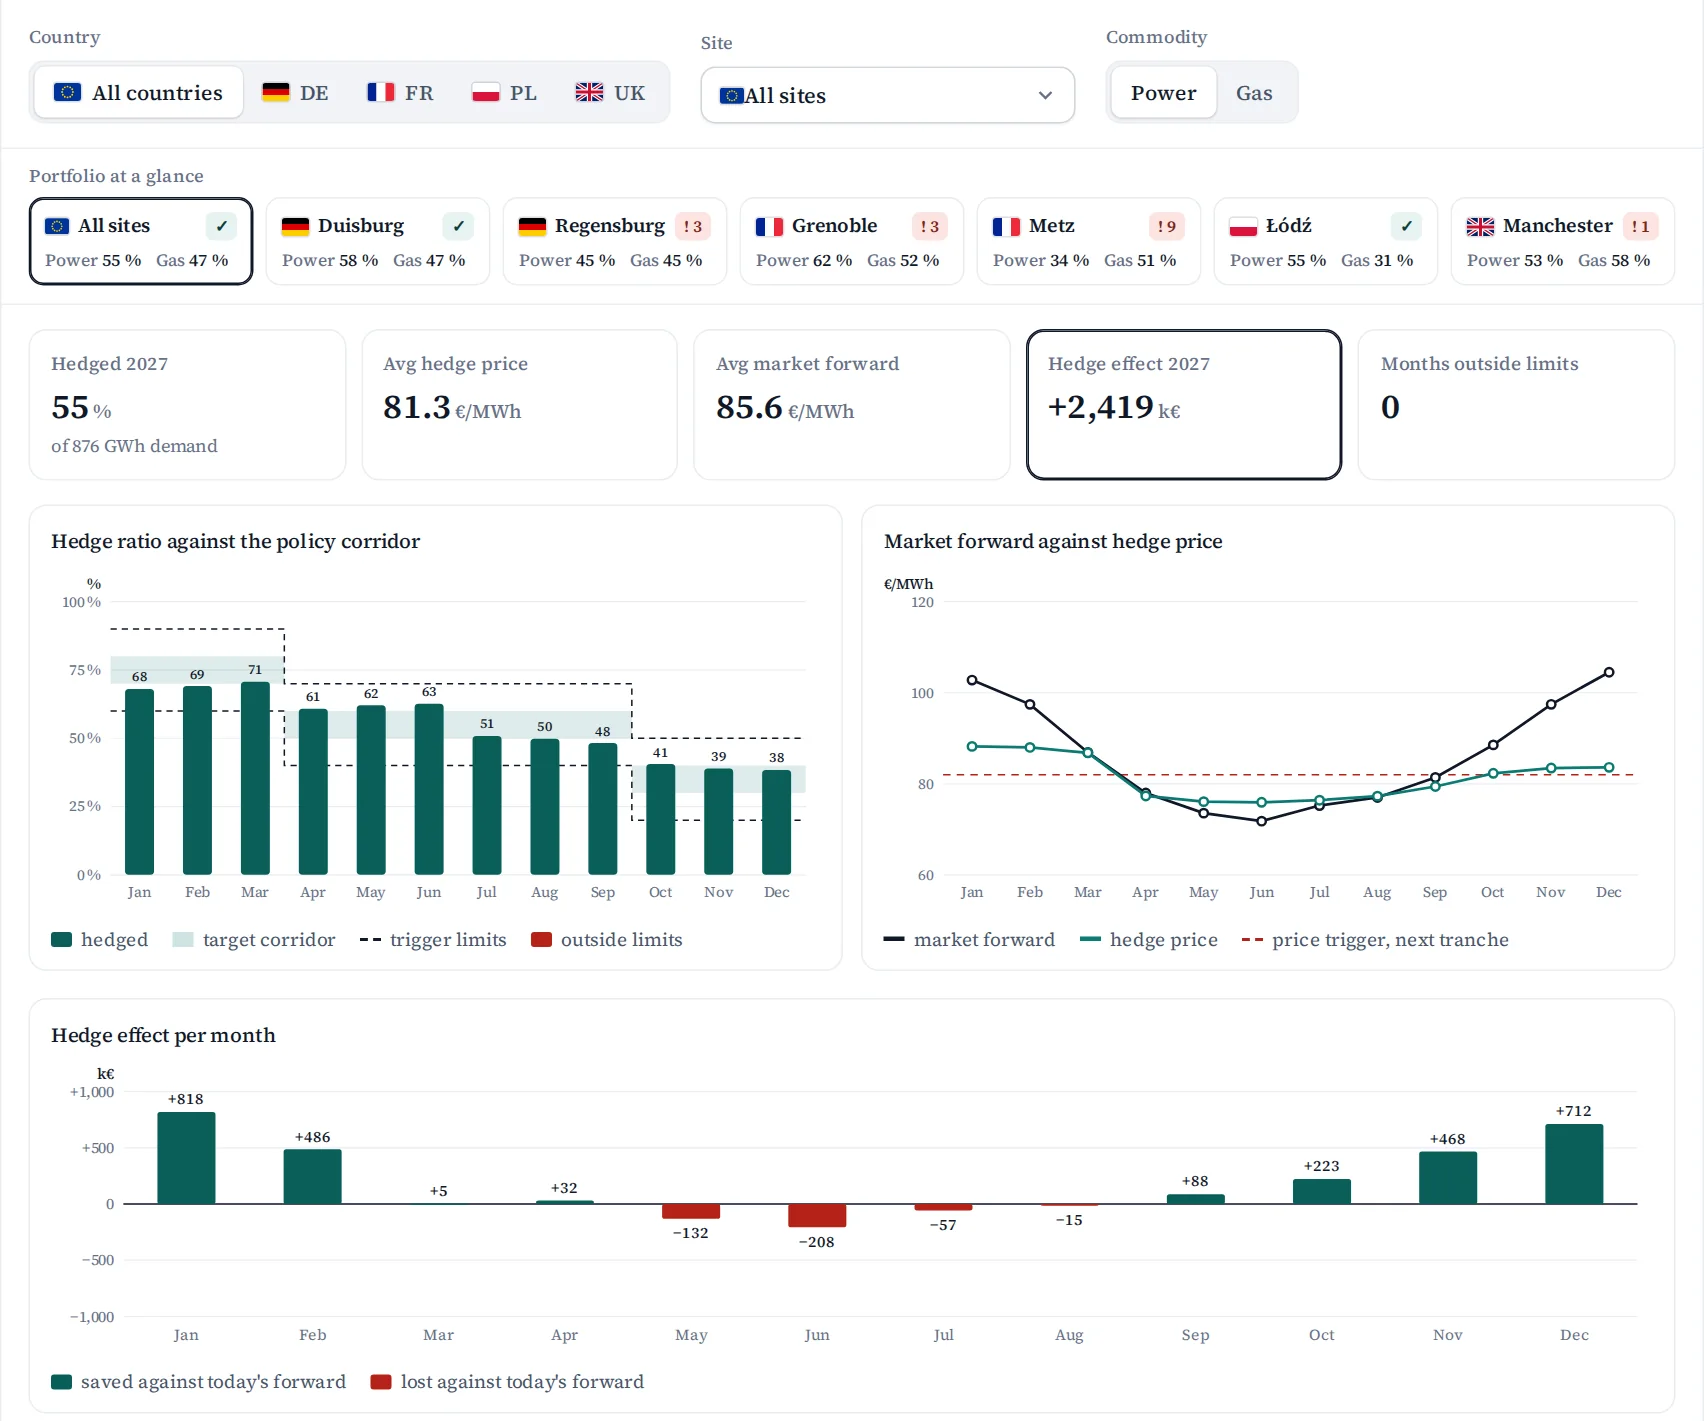
Every hedge, per site and month, against your policy corridor and its trigger limits.
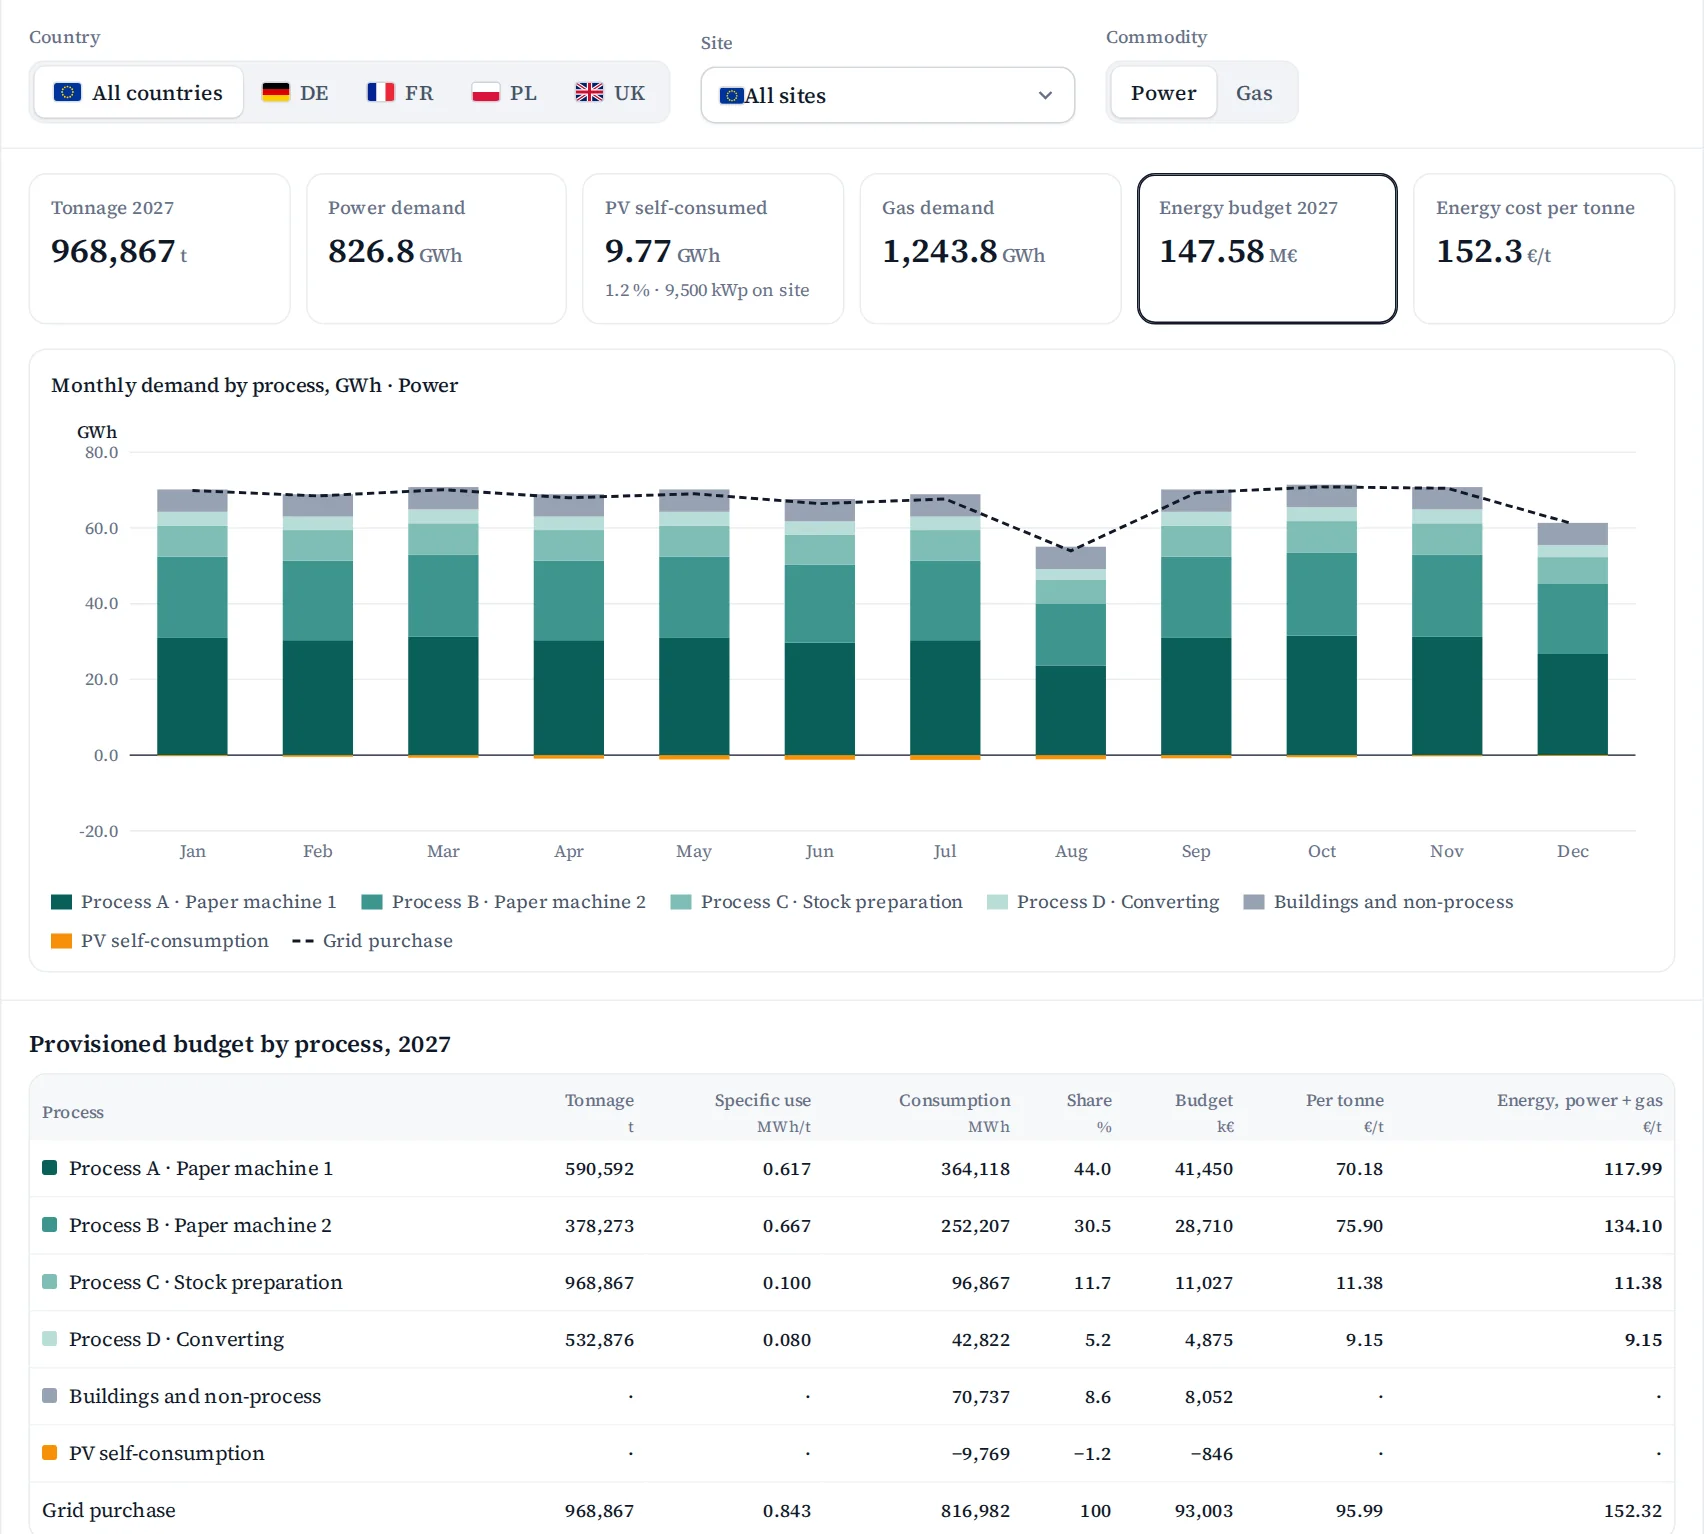
Production plan times specific use: the 2027 energy budget per process and per tonne.
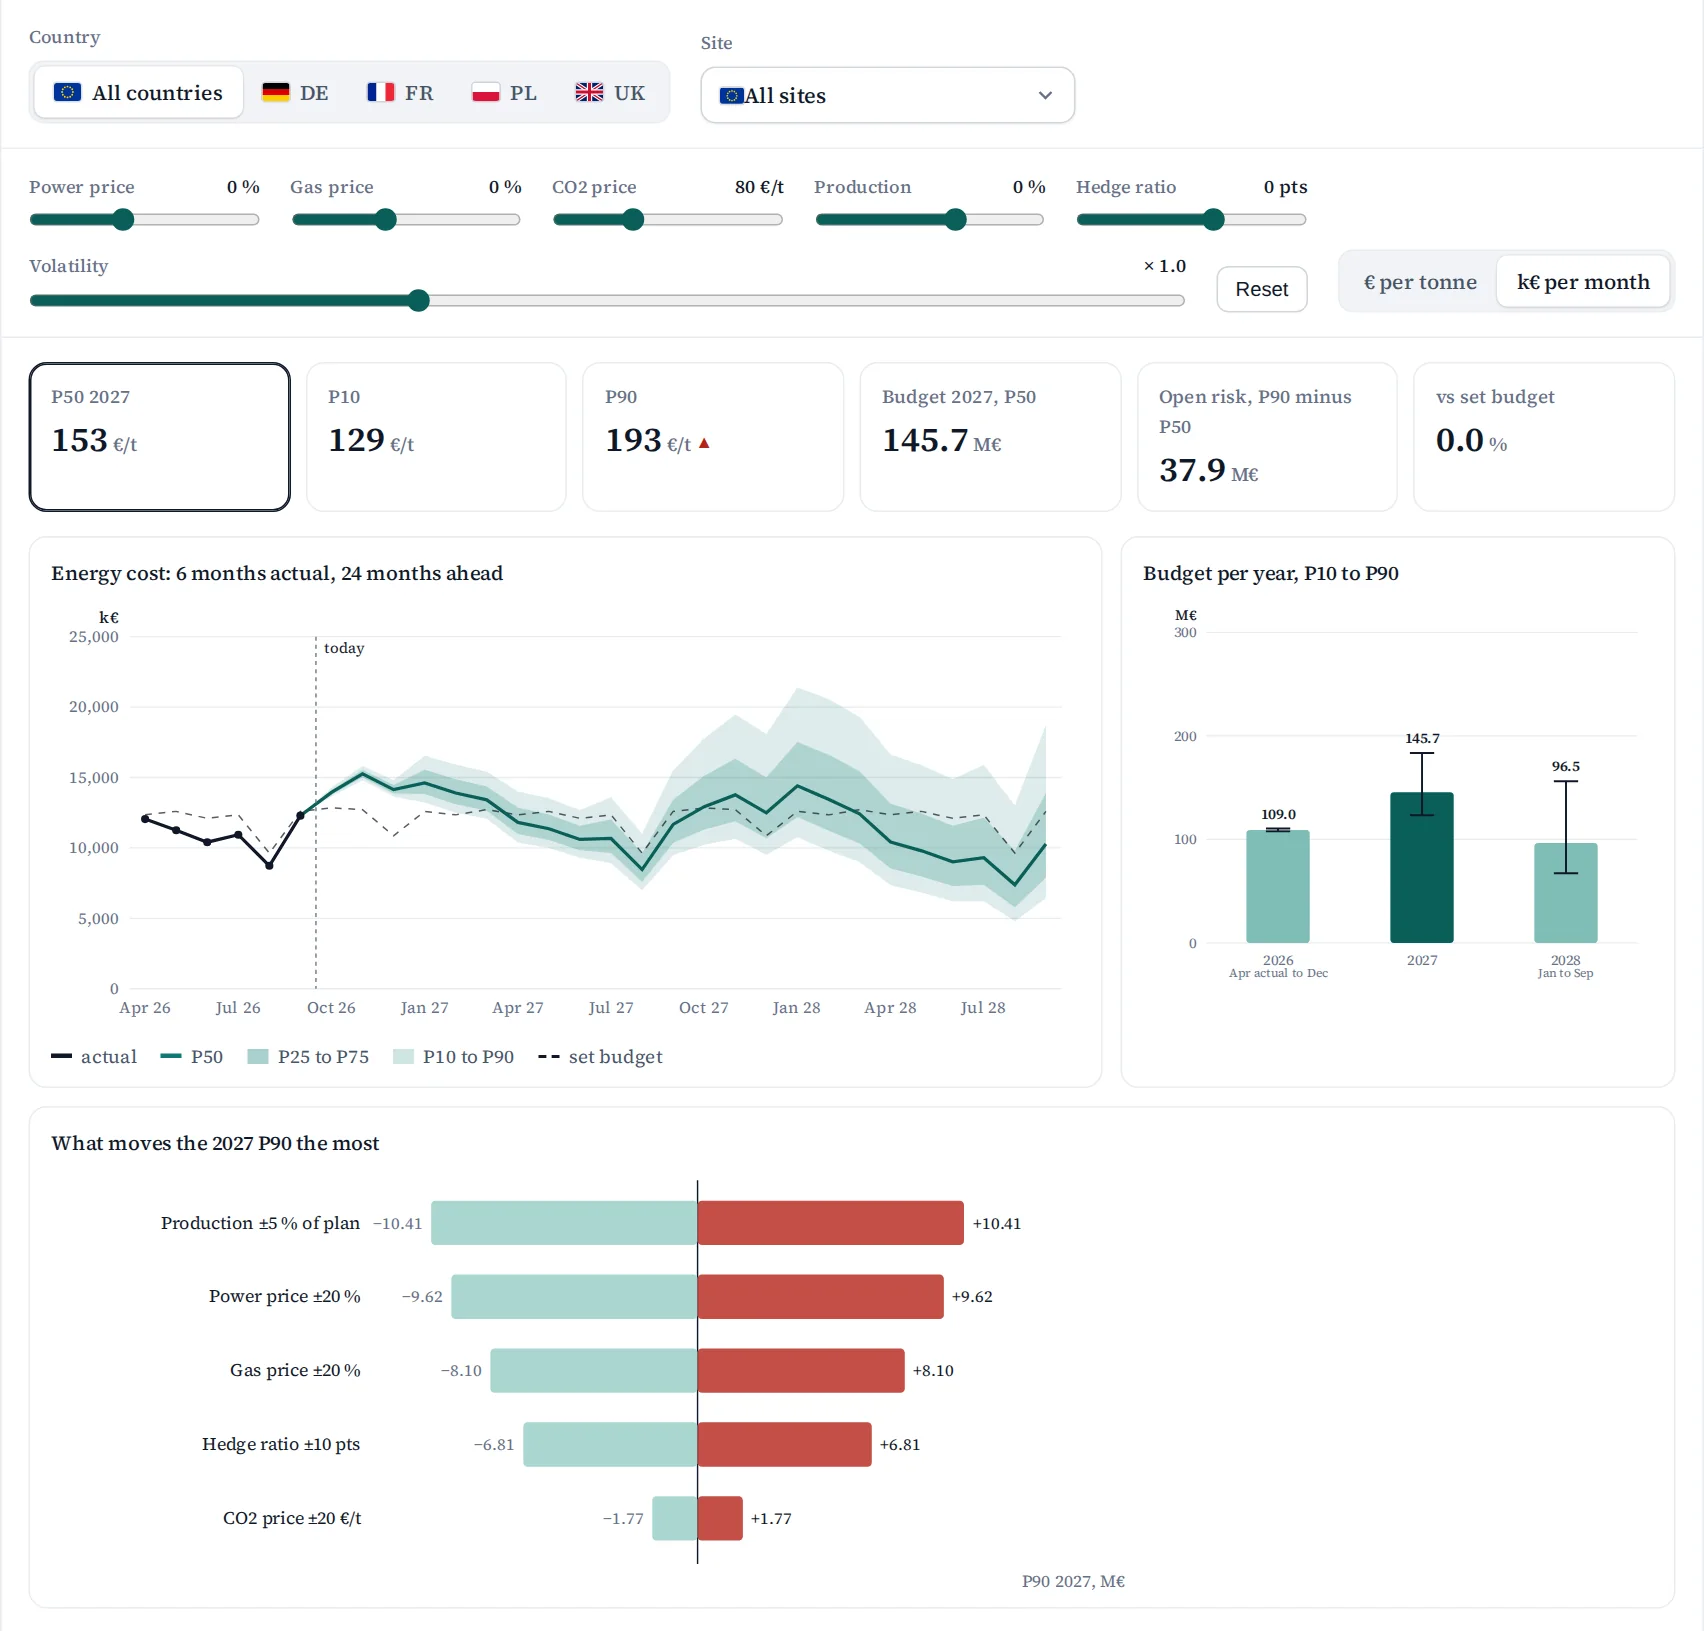
The 2027 cost corridor from P10 to P90, with power, gas and CO2 moving together, and what moves it most.
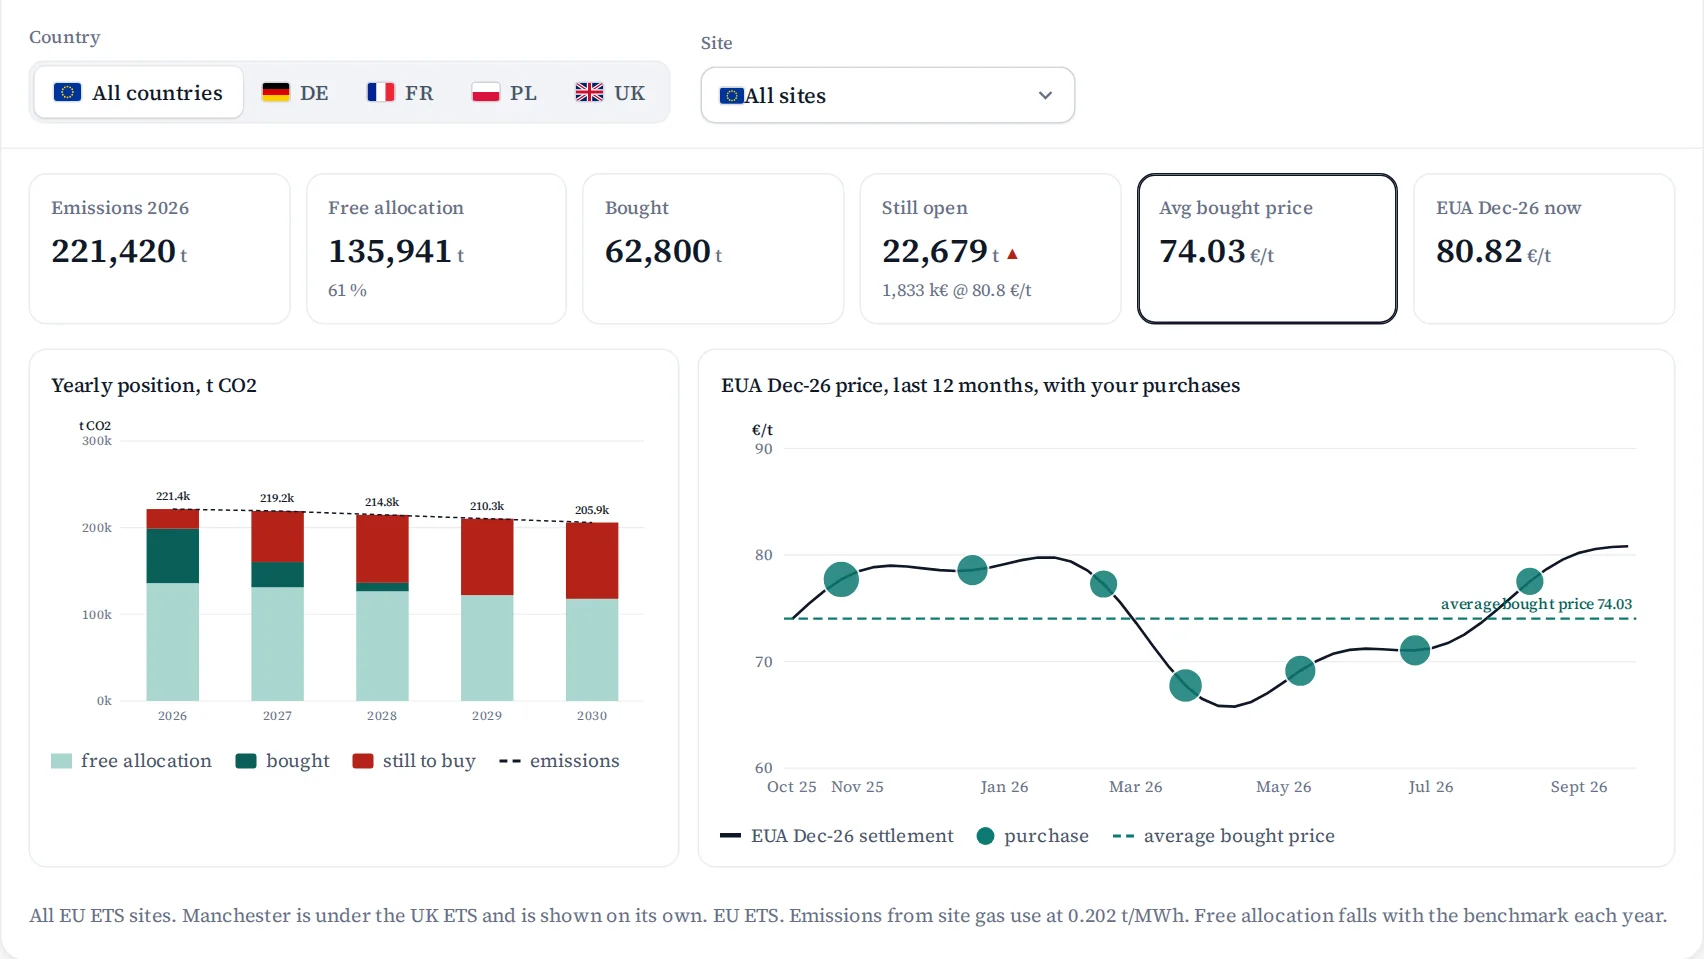
Free allocation, what is bought, what is still open, and your average price.
Screenshots on fictional mills. Synthetic data, real structure. Click an image to enlarge it.
One model. Every number.
No more reconciling five spreadsheets before a management meeting.
What is in the model
Cost per tonne Available
Energy, contracts, grid charges, taxes and CO2 for each site and month, in the unit your controllers use.
Consumption per process Available
Your production plan times what each process uses, plus buildings, minus your own solar. The energy budget per process and per tonne.
Hedging and limits Available
Every hedge and supply contract in one place, checked against your hedging policy.
CO2 position Available
Emissions, free allowances, what is bought and what is still open, at your average price.
Deal lab Available
Compare a PPA, a fixed-price deal or an option side by side, and see what each one is worth at any market price.
Scenarios Available
Your 2027 budget as a range from a good year to a bad one, with power, gas and CO2 moving together. Replay 2022 on today's contracts.
Invoice check Available
Every invoice rebuilt line by line, so the model is proven against what you actually paid.
Asset flexibility 2027
Balancing markets, fuel switching, load shedding: business cases on your own load data.
Built for energy-intensive industrial teams
One model, read by everyone who owns a piece of the energy bill.
Energy procurement
Understand hedge exposure and upcoming purchases, checked against your policy.
Finance and controlling
Build a budget corridor rather than defending one number.
Plant management
See energy cost per tonne and per process, mill by mill.
Sustainability and CO2
Track free allocation, purchases and open exposure.
Sectors
Paper and boardSteelAluminiumChemicalsGlassBuilding materialsFoodStart with one site.
A 3-month paid pilot that ends with your 2027 budget, not a slide.
You receive
- A verified energy cost baseline
- Invoice reconciliation, line by line
- Your 2027 budget corridor, P10 to P90
- Your hedge and CO2 positions
- Three market scenarios
- A final review with your finance lead
Success criteria and the subscription price are agreed in writing before we start. Criteria met: you continue on the agreed subscription. Not met: you keep the pilot report.
Pilot fee and monthly fee per site are set in the first conversations, once we know your sites. No fee per MWh, no commission.
We load your data
Load curves, contracts, hedge confirmations, CO2 account and three months of invoices. Loaded and checked by us.
Your cost base, verified
Cost per tonne per month, every invoice rebuilt line by line, every gap explained or flagged.
Your 2027 corridor
Budget per tonne from P10 to P90, three named scenarios, hedge and CO2 position included.
You decide
Continue on the agreed subscription if the success criterion written on day one is met. Otherwise you keep the pilot report.
Your effort: one data contact and read access to the files. Loading, matching and checking is our work.
Built by someone who has sat on your side of the table.
Equora's founder buys and hedges power and gas for a multi-site European industrial group: more than 2 TWh a year across four countries. Budgets, hedge books, market exposure: he has had to answer for all of them. Equora is the tool he wanted on that desk.
Questions buyers ask first
Do you forecast energy prices?
No. Equora simulates price paths around today's forward curve and shows what each one does to your cost per tonne. Nobody can forecast prices. You can know your exposure.
Who enters the data?
We do. During the pilot we load and check your load curves, contracts, hedge confirmations, CO2 account and invoices. After that, confirmations and invoices are read automatically.
What does it cost?
The pilot is a fixed fee for one site. After that, a fixed monthly fee per site. Both are agreed in the first conversations, once we know your sites and scope. No fee per MWh and no commission, so your Equora bill does not rise when your volumes fall.
We already have Excel and Power BI. Why change?
Keep Power BI for reporting. Equora replaces the workbook behind it: the grid fee and tax rulebook, the hedge settlement, the CO2 position and the scenarios, maintained by us and versioned every month.
How do you value a PPA?
On the plant's real production profile, quarter hour by quarter hour, against market prices for the same quarter hours. You see what the power is actually worth to you, and how the PPA compares with a fixed-price deal or an option in each scenario.
Which countries?
France and Germany in depth, including TURPE, the electro-intensive status, §19 StromNEV and the 7,000 hours rule. UK, Italy, the Netherlands and Poland are modelled. EU ETS and UK ETS for CO2.
What happens to our data?
The demo shown here uses fictional mills and synthetic data. Your data is used only for your model. It is never shared or sold, and you can export all of it at any time. An NDA is signed before any data moves.
Bring your 2027 energy budget. We stress it in 30 minutes.
Fifteen minutes on your situation, fifteen on a live scenario. No slides.
Or write to radhouane@equoralabs.com